The Pilbara craton is one of a select few well preserved fragments of Meso to Neoarchean continental crust. The eastern part of the craton contains the older Mesoarchean volcanics, sedimentary rocks, granites and felsic-gneisses. The volcanics and sedimentary rocks are usually refered to as supracrustal rocks due to their typically low metamorphic grade (greenschist grade). The supracrustal rocks and granite-gneisses have a map scale pattern that historically has been called a dome and keel pattern, where the granite-gneisses are ellipse shaped and the supracrustal rocks are arrayed around them.
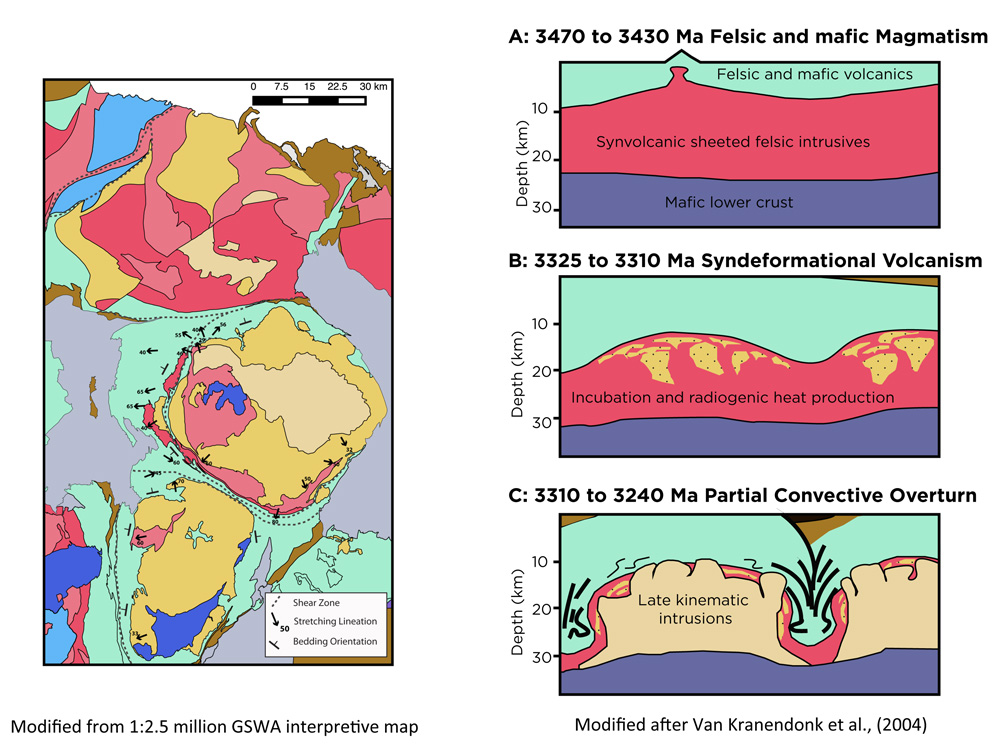 Figure 1: Geological map of the eastern Pilbara craton, showing the dome and keel structures, as well as a simple cartoon explaining the prevailing hypothesis for their formation
Although there are some structural patterns similar to this in modern terranes, none of them are a great match. This has led decades of work into better understanding how this map scale pattern forms and what are the driving forces behind them. The prevailing hypothesis is that these structures require partial convection within the crust, and require a stratified crust with dense mafic material on top of less dense felsic gneisses below in order to create gravitational instability.
This hypothesis also requires a higher geotherm in the crust. While we have good geochemical evidence that the mantle was hotter in the Archean, its not strait forward what this would mean for crustal geotherms.
What we’ve been doing is using apatite U-Pb thermochronology to try and get a new insight into the development of dome and keel structures. Pb diffusion in apatite is fast enough that essentially all radiogenic Pb is lost until temperatures cool below ~450°C, which is great because this coincides with temperatures in the middle crust. Also, since we think U-Pb ages are governed by volume diffusion, there is a strong prediction for grain size-age relationships, where larger grains should preserve older ages, and visa versa. This is a great tool for forward and inverse models for the thermal history of the granitoid-gneisses.
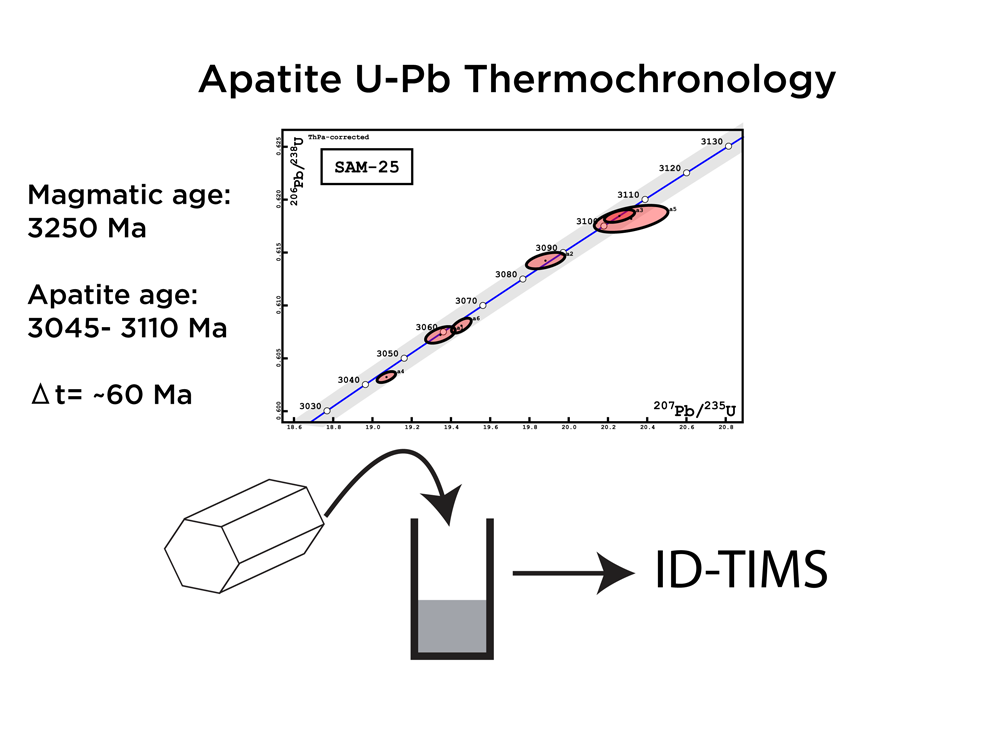 Figure 2: An example of apatite U-Pb isotopes via thermal ionization mass spectrometry. Each ellipse is a single apatite grain that was separated and dissolved. There is about 60 Myrs of age dispersion in the sample, which cannot occur through cooling after magmatic emplacement. Either the sample has been partially reset, or it was gradually exhumed out of the middle crust
As well as using TIMS whole grain U-Pb ages of apatite, we are also experimenting with laser ablation depth profiling at UT Austin with Daniel Stockli. What this involves is using a laser ablation system to drill down about 40 microns, all the while measuring Pb and U isotopes. This allows us to generate depth profiles of U-Pb age. The edge area of grains should record important information regarding the thermal history the rocks experienced.
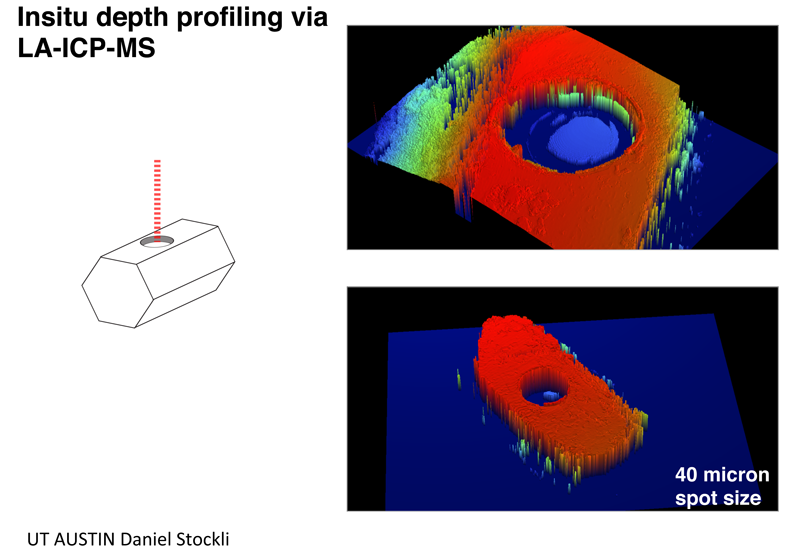 Figure 3: Illustration of laser ablation depth profiling. The images on the right show the hole size and depth left by the laser
I’ve also made a finite difference model for Pb diffusion that currently I’m only using with forward models, but aim to integrate a bayesian sampler, to try and efficiently search the parameter space to find the most likely thermal histories in a more unsupervised way.
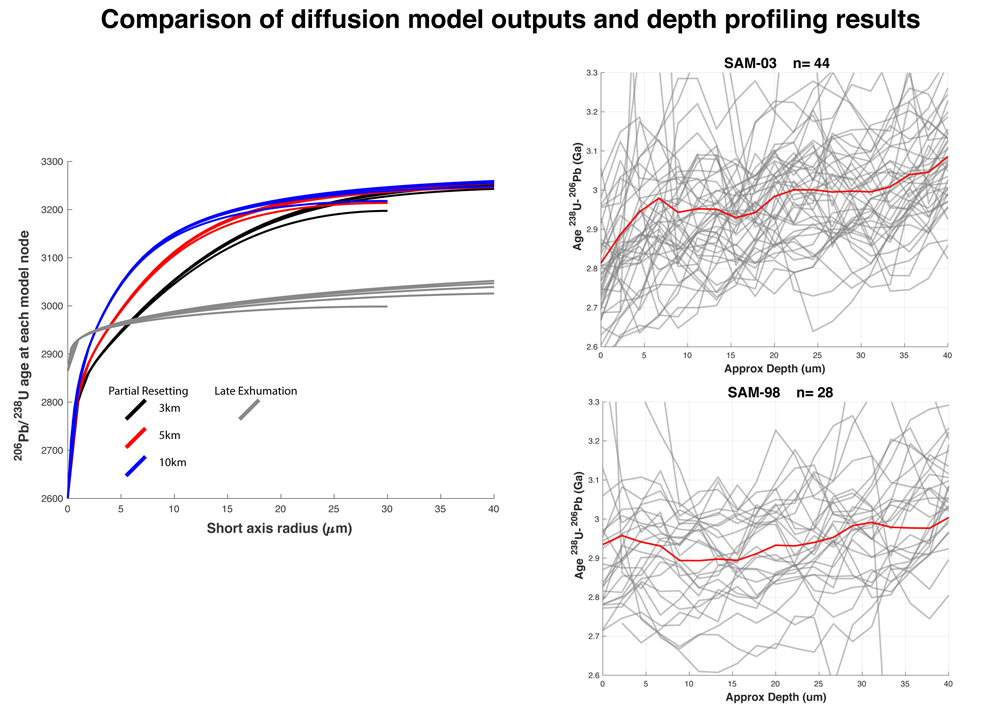 Figure 4: On the left are model outputs from my diffusion model. Essentially, one creates a temperature-time curve that gets fed into the model. It then calculates what the effect would be on Pb concentrations. The red,black and blue curves all relate to a partial resetting model where a young granite intrudes nearby. The distances are shown in the figure. The grey model is a forward model where exhumation out of the middle crust is fast, but occurs relatively late in the tectonic history of the domes. The two plots on the right are laser ablation age profiles vs depth. Each grey line is one depth profile through the outer 40 microns of a grain. The average is shown in red. Although the data are very noisy, the profiles in the upper plot seem to be steeper than those in the bottom plot. Comparisons with the model outputs show that steep Pb age profiles can be achieved through partial resetting, while flat profiles require late exhumation.